ExxonMobil Stock Looks Way Too Cheap Now With Its 3.8% Dividend Yield

ExxonMobil (XOM) stock has a 3.84% annual dividend yield as of Friday. Its average over the last 3 years has been 3.49%, implying a 10% upside in XOM. Moreover, shorting out-of-the-money put options can provide a 4% monthly yield.
XOM closed at $103.14 on Friday, April 11, up from a low of $99.83 the day before, but well off its high of $119.04 on April 1. This means its $3.96 annual dividend per share (DPS) provides investors a 3.839% annual dividend yield.

Dividend-Based Target Prices
However, compared to its average of 3.49% over the last 3 years, according to Morningstar data, this implies the stock is too cheap. For example, if we divide the $3.96 DPS by 3.49%:
$3.96 / 0.0349 = $113.47 average target
That is 10% higher than today's price. In other words, assuming that XOM stock reverts to its mean yield, the upside for XOM stock is at least 10% higher.
Moreover, I showed in my Feb 3 Barchart article ("ExxonMobil Gushes Huge Cash Flow Albeit at Lower Levels - Is it Time to Buy?") that Exxon can well afford its dividend costs from its strong cash flow from operations.
For example, Exxon expects to increase its operating cash flow by $30 billion to $87 billion from $56.848 billion in 2024 over the next 5 years. That 53% gain works out to an average 8.877% annual compounded gain each year for 5 years.
As a result, new investors in XOM stock can expect ExxonMobil could hike its dividend by at least half of that gain or 4% annually. After all, it has raised its DPS annually for the past 26 years, according to Seeking Alpha.
For example, last year it hiked the DPS by 4.2% and the year before it rose by 4.39%. So, let's assume that in November Exxon hikes the $3.96 DPS by 4.04% to $4.12 or $1.03 quarterly.
Since XOM has already paid out 2 quarters at the 99-cent rate, the blended next 12 months DPS will be $4.04 (i.e., $ 0.99x2 + $1.03x2). As a result, the new target price using the average yield is 12.2% higher:
$4.04 DPS / 0.0349 avg yield = $115.76 target price
$115.76 / $103.14 = 1.122 -1 = +12.2% upside
So, assuming a 4% dividend hike for half of the next 12 months, a new XOM investor could expect a 12% gain if it rises to the average 3-year dividend yield.
Analysts Agree XOM is Undervalued
Yahoo! Finance reports that its survey of 28 analysts has an average price target of $126.64 per share. Similarly, Barchart's survey shows a mean price target of $127.75. So, the average target price of these two surveys of $127.20 is 23% higher than today's price.
Moreover, AnaChart.com has a survey of 29 analysts with an average price target of $123.28, or +19.5% higher than Friday's close. The table below shows that the top 5 analysts have an average price target of $129.40, or +25% higher.

For example, based on AnaChart's Price Targets Met Ratio, Doug Leggate of Wolfe Securities has been right 93% of the time. His current price target is $140. Similarly, the RBC analyst has been right 88.5% of the time, and his price target is $115.
The bottom line is that, based on analysts' target prices, XOM stock looks very undervalued here.
However, there is no guarantee this will happen. As a result, one way to set a good buy-in target price is to sell short out-of-the-money (OTM) put options in nearby expiry periods.
Shorting OTM Puts Works
What if you could make a 4% yield in a less than one-month play, assuming XOM falls to $100 and you had to buy in at that price? Would you take that deal?
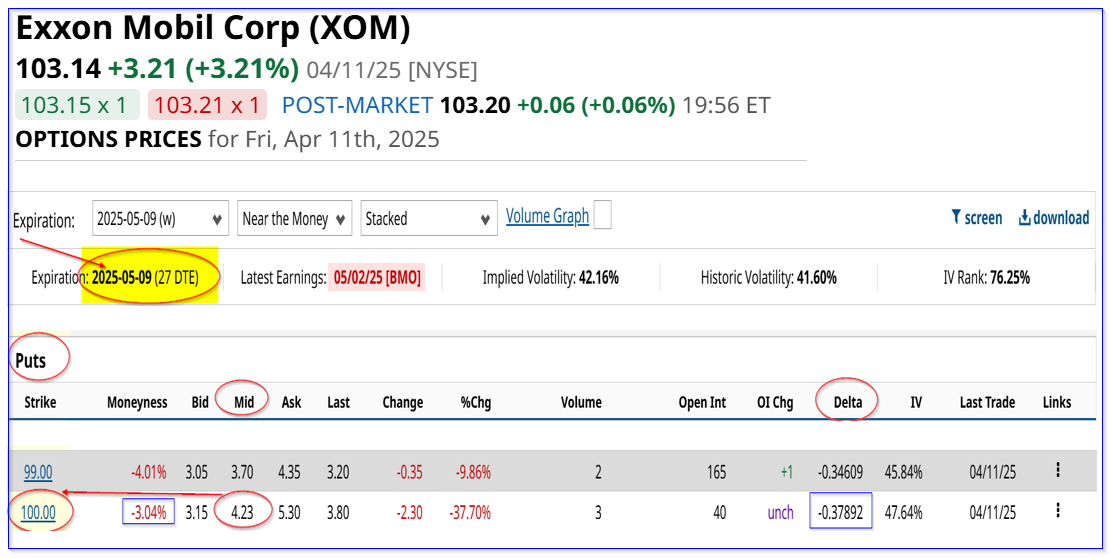
For example, the May 9 expiration period, 27 days from now (i.e., days to expiry or DTE), shows that the $100.00 strike price put option has a $4.23 midpoint premium.
That means that an investor who enters an order to “Sell to Open” a put option contract for $100 expiring May 9 will receive a 4.23% yield (i.e., $4.23/$100.00).

This occurs if the investor first secures $10,000 (i.e., 100 shares per put contract x $100 strike price) as collateral with their brokerage firm. As long as XOM stays over $100.00 over the next month, the account won't be assigned to buy 100 shares at $100.00.
Nevertheless, even if that happens, the investor's breakeven price is lower at $100 - $4.23, or $95.77. That is 7.14% below Friday's closing price of $103.14. In other words, this is a great way to set a lower potential buy-in price.
It also works well for existing investors in XOM stock who may want to take advantage of this high short-put play yield over the next 27 days. That way, they can benefit from any upside in XOM stock as well as collect the short-put yield.
Downside Risks
Obviously, there is no guarantee that XOM will stay above this breakeven point. For example, if the price of oil tanks, that could take XOM stock lower. If that happens, the investor could have an unrealized capital loss.
But, this short-put play has a low 38% delta ratio, implying just over 1/3rd chance that XOM will fall to $100 by May 9. Moreover, as I have described in other articles, investors have alternatives to improve their returns if that happens.
Moreover, at the breakeven point of $95.77, the investor would have a prospective forward yield of 4.2%:
$4.04 forward DPS (see above) / $95.77 breakeven price = 0.0422 = 4.22%
Investors can go to Barchart's Options Learn Center tabs, such as Options Trading Risks, to study the downside risks doing this play.
The bottom line is that based on Exxon stock's average yield, its prospective yield, analysts' targets, and short-put plays, XOM stock looks very undervalued here.
On the date of publication, Mark R. Hake, CFA did not have (either directly or indirectly) positions in any of the securities mentioned in this article. All information and data in this article is solely for informational purposes. For more information please view the Barchart Disclosure Policy here.